Author: Rahul Goel (NetID: rg764)
I. Objective
The objective of this lab is to add the IMU to our robot, start running the Artemis+sensors from a battery, and record a stunt on your RC robot.
II. Materials/Software
- 1x SparkFun RedBoard Artemis Nano
- 1x USB A to C Cable
- 1x IMU Sensor
- 1x Quik Connector
- The RC Car kit
- Batteries
- Arduino IDE (Software)
- JupyterLab (Software)
III. Procedure/Design/Results
System Setup
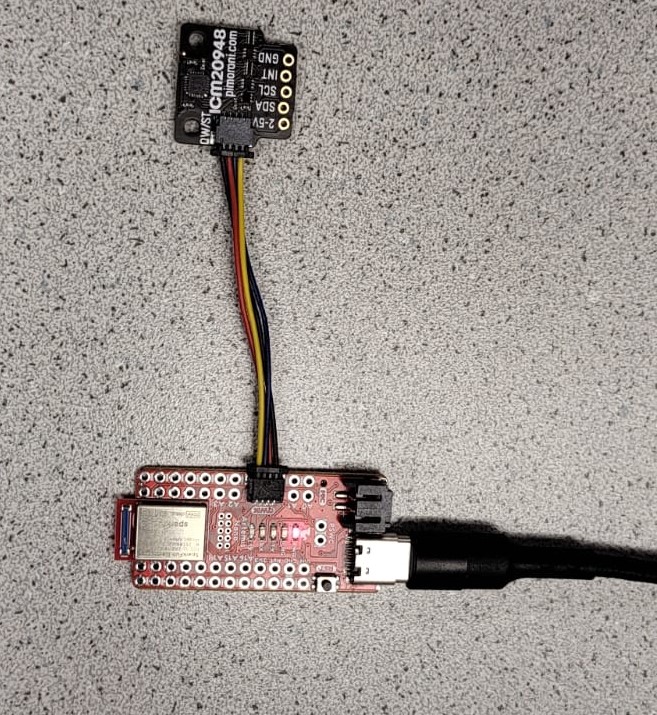
Wires are connected from the Artemis Board to the IMU (Inertial Measurement Unit) Sensor using the connectors provided.
Accelerometer
We used the calculations shown in the accompanying image, combined with the Arduino example script, to convert accelerometer data into roll and pitch angles (tilt). We tested the system by situating it at table edges to acquire pitch and roll data at {-90, 0, 90} degrees. The IMU (Inertial Measurement Unit) performed well with plenty noise. However, strange behavior, defined by abrupt jumps in readings, was observed around angles approaching 90 and -90 degrees. These anomalies were identified being caused by the singularities at the poles of the sphere.
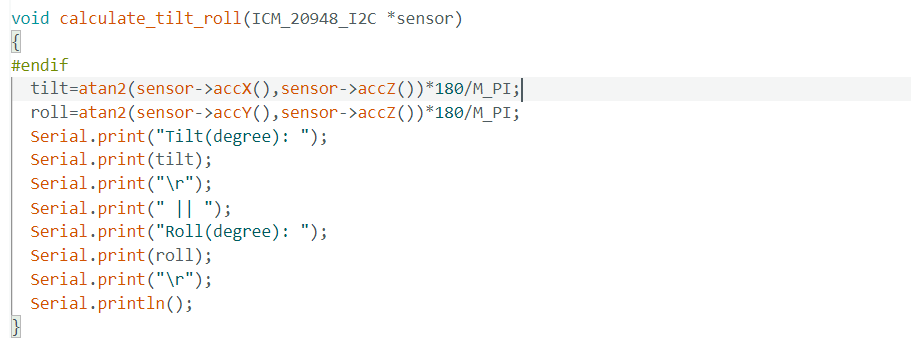
When we started the IMU, we found that the accelerometer reading was close to zero as expected with cnsiderable amount of noise, indicatig that no two-point calibration was needed.
As we started with the application of the low pass filter we decided to go for a FFT analysis to find the cutoff frequency. Following the instructions given, the following result was generatedas the result of FFT analysis:
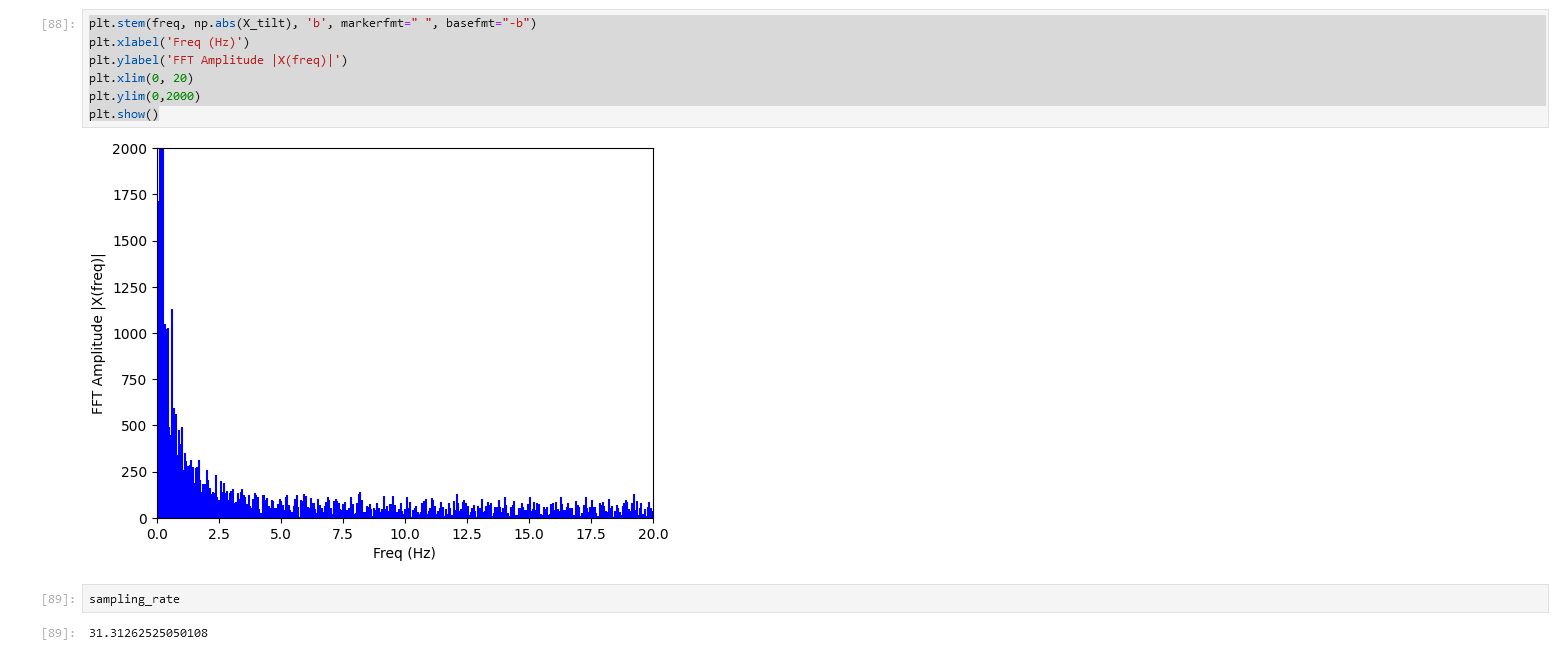
From the plot we figured out that the cuttoff frequency is around 4hz (most of the spikes are to the left of the point) and after applying the simple low pass filter, the results are as follows.
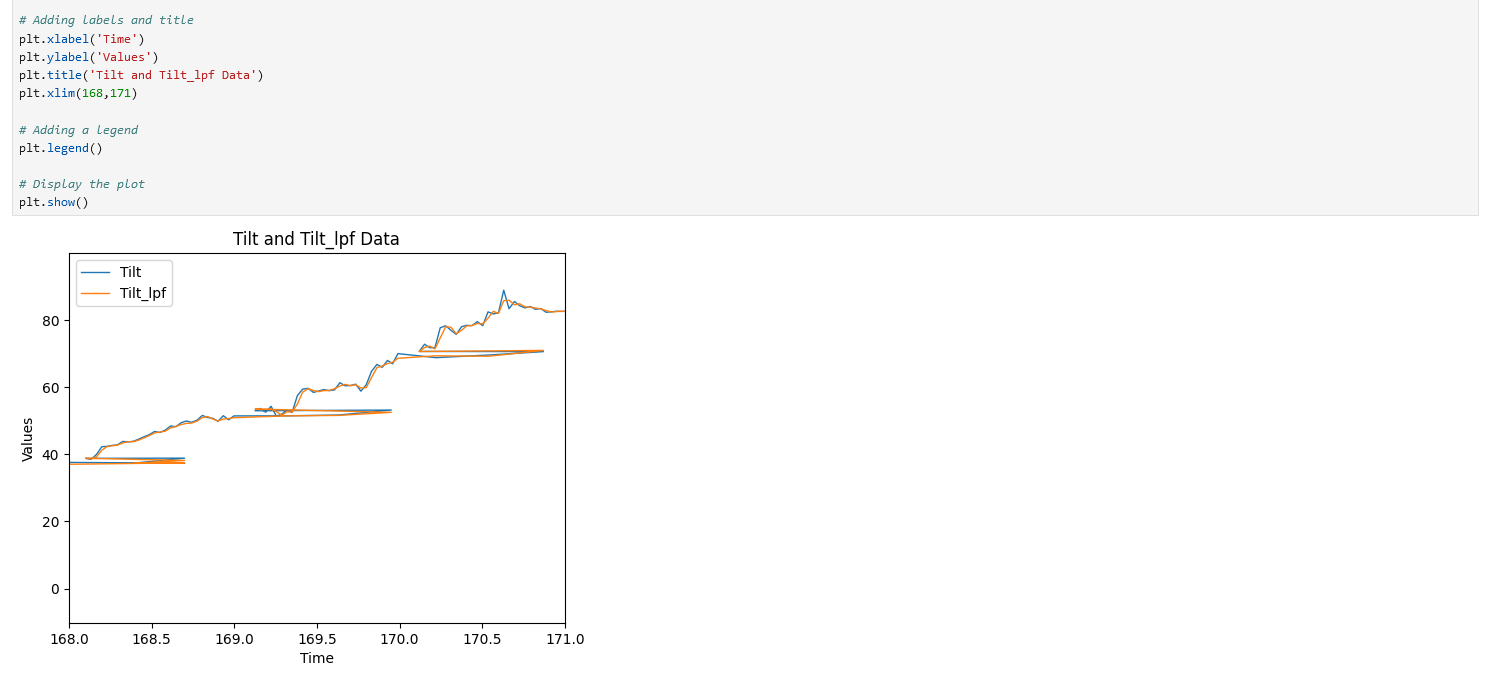
Overall, the results of the simple low pass filter was little better and smooth as compared to the raw pitch and roll, but still the noise was not completely removed.
Gyroscope
The pitch, roll, and yaw of the gyroscope was calculated by using the equations discussed in the lectures. Since the gyroscope measures the angular velocities, integration of those values will provide the tilt angles. The output of the gyroscope had much less noise compared to the output of the accelerometer. It can also be noticed that the gyroscope readings tend to drift instead of stabilizing at a particular point. This can be caused due to the noise build up in the gyroscope. Lastly, the gyroscope also requires initial value to output sensor readings.
  gyro_X_angle = gyro_X_angle - sensor->gyrX() * dt;
  gyro_Y_angle = gyro_Y_angle - sensor->gyrY() * dt;
  gyro_z_angle = gyro_z_angle - sensor->gyrZ() * dt;
  SERIAL_PORT.print("Gyro Roll:");
  printFormattedFloat(gyro_X_angle,3,2);
  SERIAL_PORT.print(",");
  SERIAL_PORT.print("Gyro Pitch:");
  printFormattedFloat(gyro_Y_angle,3,2);
  SERIAL_PORT.print(",");
  SERIAL_PORT.print("Gyro Yaw:");
  printFormattedFloat(gyro_Z_angle,3,2);
  SERIAL_PORT.println();
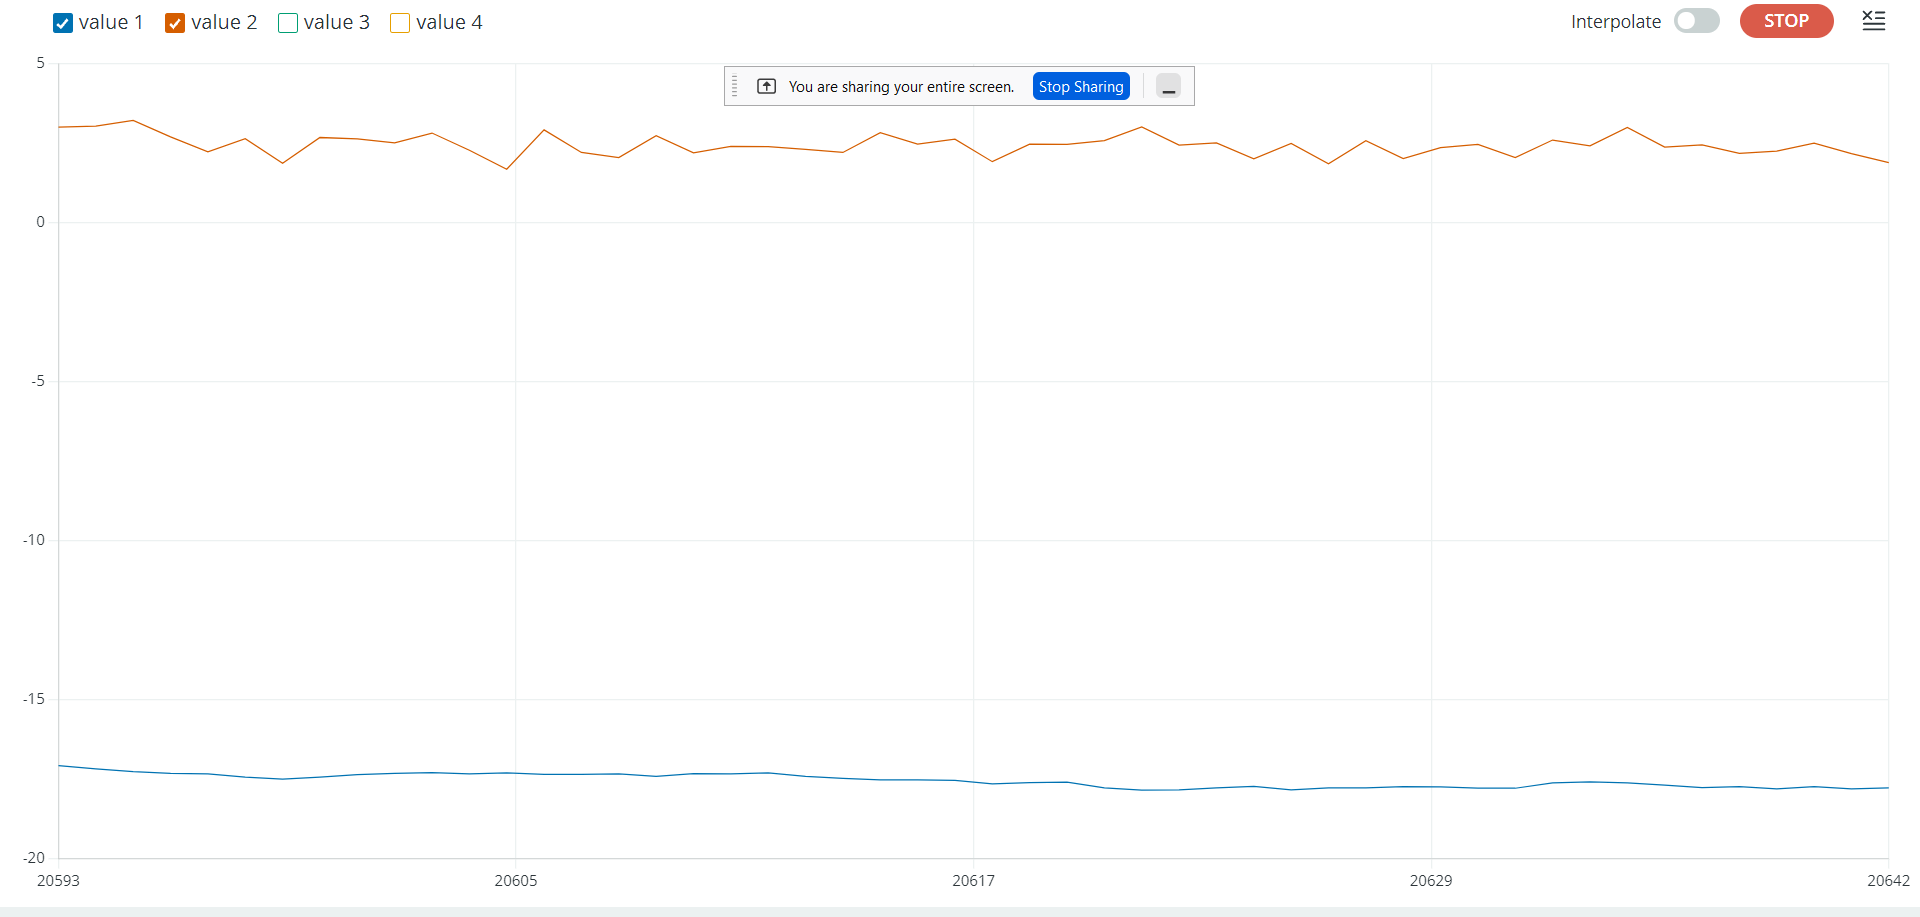
Using a complementary filter of 0.1 and combining the accelerometer and gyroscope readings, precise roll and pitch angles were computed as seen below. Sensor fusion and a filter in conjunction turn out to stabilize the sensor extremely well. The results annd application of the fusion is as follows:
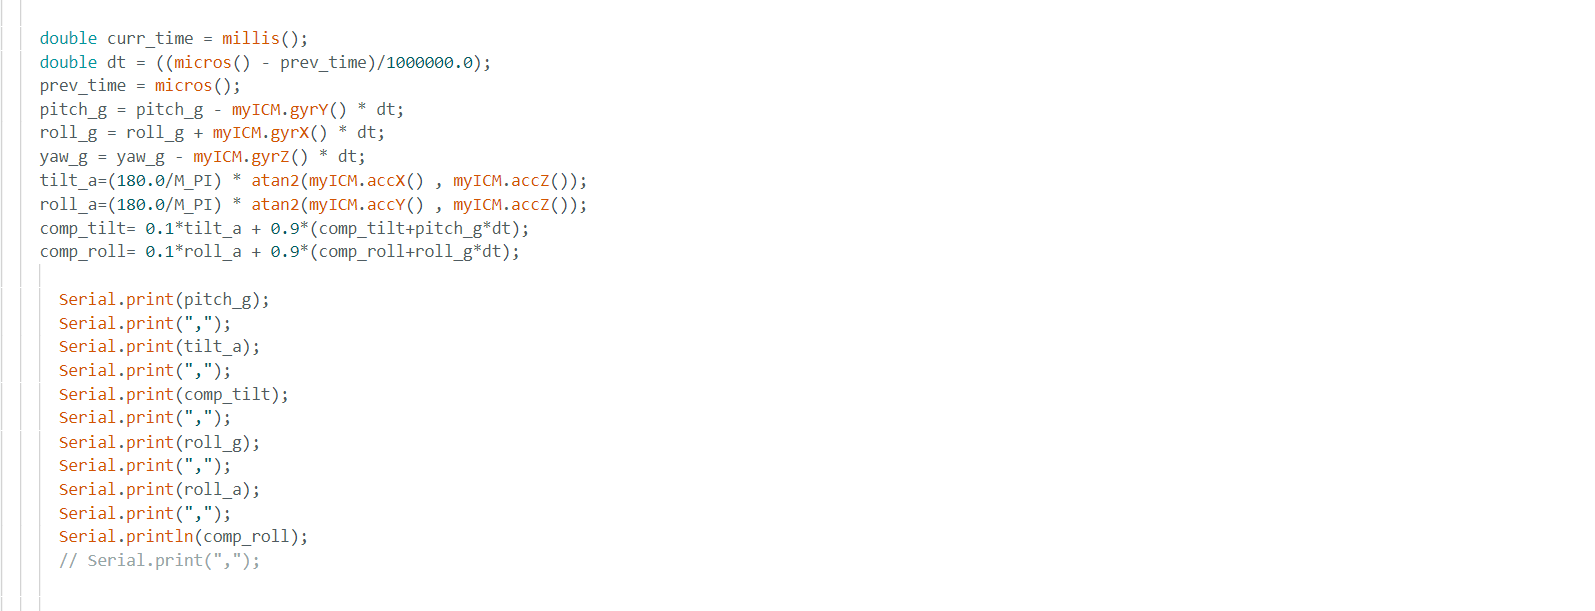

Sample data
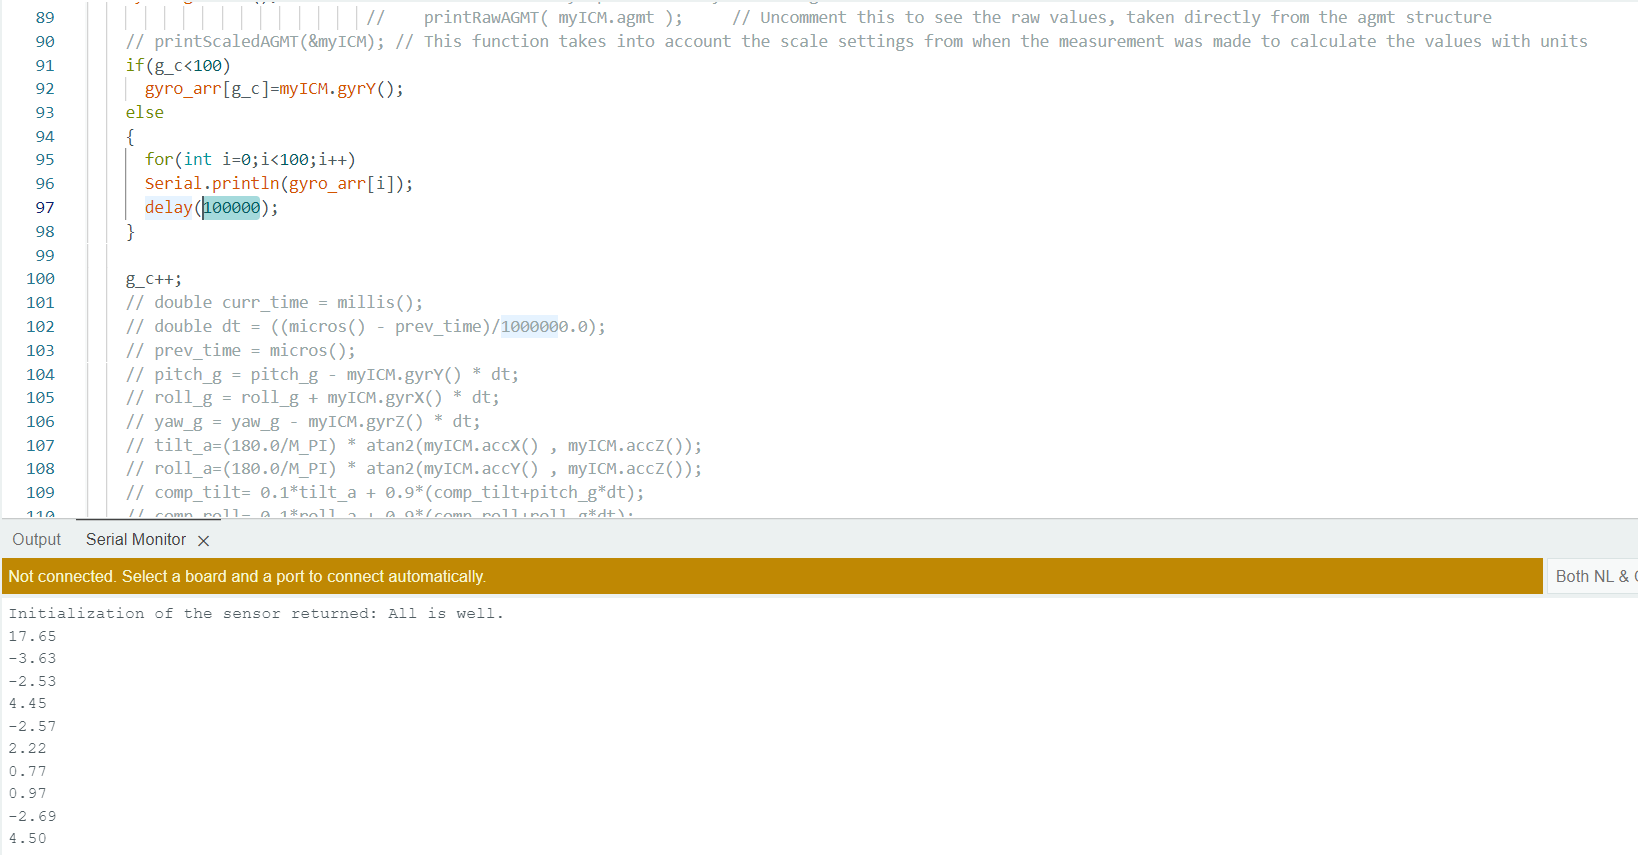
To confirm if IMU can run faster than the loop function, we cleared out the loop function as much as possible leaving only the data getting and storing part. Now, I created a counter which ensures that the data is getting stored till the number of data collected is 100. Once it reaches 100, I print the data, the idea of printing the data at the end is to ensure that no timee is wasted in Serial.print while recording, so that void loop() runs as fast as possible. As we look at the printed data, we find that each data in the array is different indicating that IMU produced new data every single time loop was running, showing that sampling rate of arduino is faster than the loop function.
In the second phase aimed at ensuring that Artemis can retain a minimum of 5 seconds’ worth of data, I implemented a loop to store approximately 2000 data points received from the Arduino. I organized the information into seven arrays: three for accelerometer data, three for gyro data, and one for timestamp records. Subsequently, I transmitted the data to the Python side through the established Bluetooth connection. By calculating the difference between the timestamps of the last and first data points, I determined the duration for which the data was stored. The recorded time period amounted to 5284 milliseconds, meeting the specified requirements outlined in the laboratory instructions.
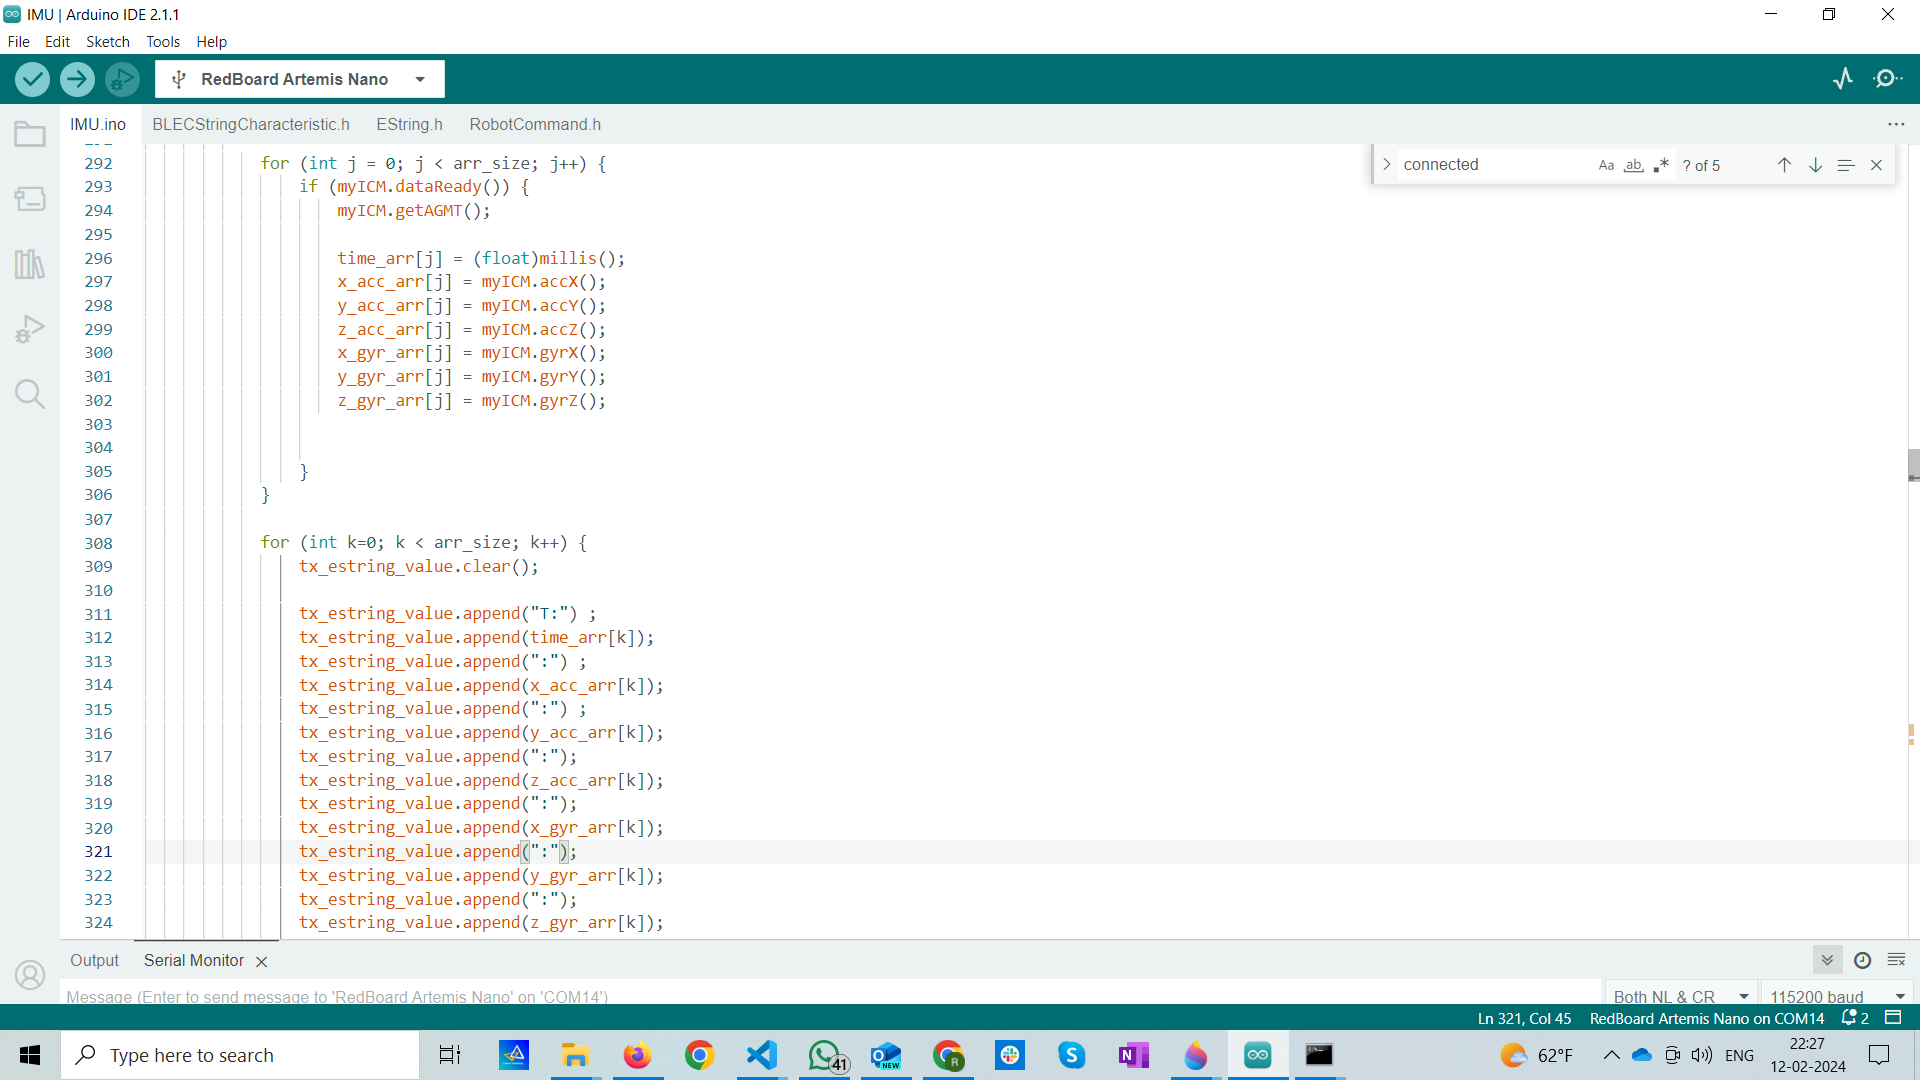

As seen in the code I prefer individual arrays on the artemis side to store data while transmit them as a single string. This helps me in easy manipulation of individual data as per need
Stunt with the robot
We assembled the robot with charged batteries and performed some stunts to confirm that each components of the robot works fine and to get the sense of the speed and working of the robot.
IV. Conclusion
The objectives of this lab were successfully completed. The IMU was wired, tested, and analysed as per the requirements and instructions. Overall, the lab went quite smooth and the lab guideline proved to be very helpful.